All the interviews, articles and blogs to do with eCabs’ mobility product and technology on the eCabs website will fall under this tag.

Posts

The innovator’s dilemma: Legacy taxi operators vs Uber

The innovator’s dilemma: Legacy taxi operators vs Uber

The last of the taxi roof lights are flickering out, and their once-buzzing dispatchers’ radios are falling silent. Across Europe and beyond, long-standing legacy taxi operations face a formidable challenger: ride-hailing applications like Bolt and Uber are sweeping through every market, in every jurisdiction, gobbling up riders and drivers alike.

Contrary to what you might read elsewhere, legacy taxi businesses do not face an uncertain future. They face a clear and inevitable reality: ride-hailing is here to stay. The critical question as the rides industry continues to grow year-on-year is not if traditional taxi businesses will survive but who will take the largest slice of the pie: disruptors or traditional operators?

The dangers of complacency

Fifteen years ago, eCabs was born as a traditional dial-a-cab business. Like most legacy taxi businesses, we manually registered bookings and dispatched rides from our bookings office. I remember those days—passengers queuing outside our dispatch centre after a night out, drivers waiting idly for their turn to be called on the tannoy.

However, we founded eCabs with the intent to digitize our rides service. We built our own digital platform, on bare metal infrastructure, with all the complications that come with it. We’ve experienced the tricky transition from one system to another—patches upon patches, and late-night scrambling to get back online. All the while, we were competing against the largest ride-hailing platform in the region, Bolt.

Over the years, I’ve learned that disruption can come in pitter-patter, showers, or torrential downpours. In Malta, it was a deluge. After Bolt, came Uber. Today, eCabs is the only locally grown ride-hailing operation in its home market, with other businesses in different jurisdictions running on our platform. This success stems from our continuous investment in our digital offering, from partnering with global leaders like the Google Maps Mobility Platform to headhunting talent from leading ride-hailing tech players.

Facing the real threat

What we’ve learned is that the greatest threat traditional taxi businesses face today isn’t innovation and disruption; it’s the temptation to ignore transformative change. The danger is in burying heads in the sand, hoping ride-hailing tech will simply go away. Take it from me—it won’t. These giants are coming for the traditional taxi businesses, and the answer isn’t in ignoring the change but embracing it.

Legacy operators must become disruptors themselves if they want to survive. Harvard Business School professor Clayton Christensen introduced the concept of the Innovator’s Dilemma in 1997, explaining how established companies often focus on sustaining innovations—incremental improvements to existing products—at the expense of recognizing disruptive innovations on the horizon. These major changes may initially serve niche markets, but they have the power to redefine entire industries.

For legacy taxi businesses, the disruption came in the form of ride-hailing apps. Ignoring these innovations is a recipe for obsolescence. As Uber’s own CEO Dara Khosrowshahi said nearly seven years ago: “If you don’t disrupt yourself, someone else will.”

How to fight back

Digital transformation isn’t a button you press; it’s a process. What eCabs has developed isn’t just a white-label patch for legacy businesses trying to add a digital component to their service. We’ve packed 15 years of hands-on industry expertise into a platform built from real-world experience—competing against global ride-hailing giants, managing fleets, developing data-driven rider marketing campaigns, and educating policymakers.

This isn’t a first aid kit for traditional businesses; it’s a journey for operators who want to become regional leaders in mobility. Because make no mistake, global ride-hailing platforms aren’t coming for a piece of the pie—they want the entire thing.


Matthew Bezzina will be a key speaker at the upcoming Start-Up Festival in Malta. The festival brings together entrepreneurs, investors, and enthusiasts to explore cutting-edge technologies, disruptive business models, and groundbreaking solutions. A highlight is the “Dream Big Malta” panel, celebrating the achievements of individuals from Malta excelling in international business, professions, or sports.

The original article may be found here.

Using machine learning for time series prediction and forecasting

Using machine learning for time series forecasting with SARIMAX in Python

In this blog post, we’ll explore how to make use of SARIMAX, a powerful statistical method, in conjunction with machine learning techniques for time series forecasting using Python within the mobility industry.

With the introduction of machine learning, traditional statistical methods have been enhanced to deliver more accurate and robust predictions.

In ride-hailing, predicting customer volumes is essential for optimising operations, managing resources efficiently, and enhancing customer experience. This can be achieved with time series forecasting techniques like SARIMAX.

Time series forecasting techniques like SARIMAX can play a crucial role in this regard.

We will demonstrate how we can apply SARIMAX to predict customer volumes in the mobility sector.

What is SARIMAX?

Seasonal Autoregressive Integrated Moving Average with Exogenous Regressors (SARIMAX) is a statistical method commonly used for time series analysis and forecasting. 

It extends the ARIMA model by incorporating additional parameters for seasonal variations and exogenous variables.

SARIMAX models are widely used in industries such as finance, economics, and healthcare for predicting future values based on historical data patterns.

We also use it within the mobility industry.

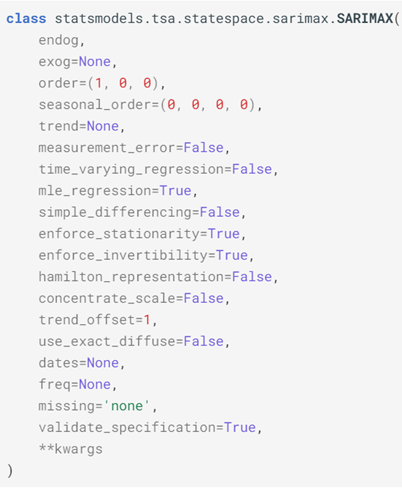
As can be seen in the below snapshot of possible inputs for this statistical method, the Python package has a diverse number of possible variables that the analyst can use to personalise the tool with.

The ones most typically amended with company-specific values are ‘order’ and ‘seasonal order’ and rest are commonly left with their default values as described here

Leveraging machine learning for time series prediction and forecasting 2

Mathematical Formulation

Leveraging machine learning for time series prediction and forecasting 2

For the mathematically minded, this is how the method is defined using three sets of parameters. 

The three sets of parameters:

  • Seasonal Parameters (p, d, q, P, D, Q, s):
    • p: Autoregressive order for the seasonal component.
    • d: Degree of differencing for the seasonal component.
    • q: Moving average order for the seasonal component.
    • P: Seasonal autoregressive order.
    • D: Degree of differencing for the seasonal component.
    • Q: Seasonal moving average order.
    • s: Seasonal period (e.g., 24 for hourly data, 7 for weekly data, 12 for monthly data and 4 for quarterly data)
  • Non-seasonal Parameters (p, d, q):
    • p: Autoregressive order for the non-seasonal component.
    • d: Degree of differencing for the non-seasonal component.
    • q: Moving average order for the non-seasonal component.
  • Exogenous Variables (X):
    • Additional variables that are incorporated into the model to capture their influence on the time series.

In ‘English’

  • The Seasonal Component in SARIMAX accounts for seasonal patterns in the time series data. Seasonality refers to repeating patterns that occur at regular intervals, such as daily, weekly, or yearly cycles. By incorporating seasonal parameters, SARIMAX can capture and model these patterns effectively.
  • The Autoregressive (AR) Component of The autoregressive component of SARIMAX models the relationship between an observation and a number of lagged observations (i.e., past values of the time series). This component captures the dependence of the current value on its previous values.
  • The Integrated (I) Component: The integrated component of SARIMAX accounts for non-stationarity in the time series data by differencing. Non-stationarity refers to the presence of trends or irregular patterns that change over time. By differencing the data, SARIMAX transforms it into a stationary series, making it suitable for modelling.
  • The Moving Average (MA) Component: The moving average component of SARIMAX models the dependency between an observation and a residual error from a moving average model applied to lagged observations. This component helps capture short-term fluctuations and noise in the data.
  • The Exogenous Variables (X) in SARIMAX allows for the inclusion of exogenous variables, which are external factors that may influence the time series but are not part of the time series itself. These variables could be economic indicators, weather conditions, or any other relevant factors that affect the phenomenon being studied.

Workflow of SARIMAX Modelling

  1. Data Collection and Preparation:

One must first gather historical data on customer volumes from the company’s database or other such relevant sources. This data could include metrics such as the number of ride requests or bookings per hour/day. This data must then be pre-processed by handling missing values, removing outliers, and converting timestamps to appropriate datetime objects. 

  • Exploratory Data Analysis (EDA):

One must then conduct exploratory data analysis to understand any underlying patterns or trends in customer volumes. The time series data is then visualised using line plots, histograms, and seasonal decomposition to identify seasonality, trends, and any anomalies which are to be used in the next stage.

  • Model Building:

The Machine Learning (ML) portion of the process starts here by splitting the dataset into training and testing sets, ensuring that the temporal order is maintained. A SARIMAX model is fit to the training data, specifying the appropriate parameters such as order and seasonal order based on the identified patterns in the data in the previous step. One may also include exogenous variables such as weather conditions, holidays, or events that may influence customer volumes at this stage.

  • Model Evaluation:

The performance of the SARIMAX model is then evaluated using metrics such as Mean Absolute Error (MAE), Mean Squared Error (MSE), and Root Mean Squared Error (RMSE) on the testing set. The forecasted customer volumes are compared with the actual values to assess the accuracy of the model.

  • Forecasting:

The trained SARIMAX model is then used to generate forecasts for future time periods, capturing variations in customer volumes. The forecasted customer volumes are visualised along with prediction intervals to provide insights into the uncertainty associated with the predictions.

Conclusion

Predicting important metrics as accurately as possible is vital for making data-driven decisions within businesses, particularly those within the mobility industry as it allows for the optimisation of operations and customer experience.

By making the most of the tools at hand, particularly packages like SARIMAX in Python for time series forecasting, ride-hailing companies such as eCabs can try to anticipate fluctuations in demand and supply within such a volatile market.

Julia Vella
Safeguarding the three pillars of technology

Navigating the digital maze: Tales from the tech frontline

In this blog, eCabs Systems & Network Administrator Osama Belaama dives into the digital maze of the three pillars of technology – first line tech support, network, and security.

Tech presents both opportunities and challenges. For businesses like ours, navigating this area requires a keen understanding of tech support, network management, and cybersecurity.

At eCabs Technologies, we believe that technology is the backbone of our operations. And I am committed to realising this every day.

By giving the areas below the attention they deserve, businesses not only ensure smoother operations but also fortify themselves against potential threats.

First line tech support to the rescue

In the vast landscape of technology, first line tech support stands as the front-line defenders, ensuring a smooth experience for end users.

Whenever a user finds a technical glitch, it’s the first line support that rushes to the rescue.

The primary role is not just troubleshooting the cause but also understanding, and guiding users with patience and expertise.

First line tech support makes technology approachable, ensuring a smoother digital experience for everyone. In principle, they are the human touch in an increasingly digital world.

A strong network is not just a luxury

A robust network is essential. Think of it as the highways and roads in a city. The more efficient they are, the smoother the traffic flow.

Similarly, in the digital area, a strong network ensures efficient data transfer, seamless communication, and optimal user experience.

However, just as a pothole can disrupt your drive, network issues can interrupt a business’s operations.

Moreover, as businesses evolve and grow, their networks must be agile and scalable.

Technology is an enabler but not a complete solution. Use it to reduce risk – but be prepared for a breach.

eCabs Systems & Network Administrator Osama Belaama

Utilising a robust network infrastructure not only streamlines communication and traffic flow but also safeguards critical business information against potential cyber threats.

Security: safeguarding the digital system and infrastructure

Finally, the final of the pillars of technology – and the most important aspect of business nowadays – is security.

With a rising number of cyber threats, security isn’t just an option; it’s a priority.

A single breach can lead to financial loss, damage to reputation, and a loss of trust. Therefore, it’s vital for every user to identify the importance of digital security.

Whether it’s about setting strong passwords, MFA (Multifactor Authentication) or understanding phishing threats, a little knowledge can go a long way. Knowledge is always your best defence.

No such thing as 100% invulnerability… ever

This is a crucial fundamental truth.

Despite our best efforts in deploying firewalls, adopting MFA, or integrating IDS (Intrusion Detection System) and IPS (Intrusion Prevention System), the advent of supercomputers and sophisticated hacking techniques has proved that every digital fortress is vulnerable.

Technology is an enabler but not a complete solution. Use it to reduce risk – but be prepared for a breach.

Even with all these advanced warnings, one of the most vulnerable aspects that may result in significant business loss is the user themselves.

According to research, 88% of all cyberattack incidents are caused by an employee. Either due to a mistake or lack of awareness.

An accidental click on a malicious link, a download from an unverified source, or simply entering their credentials on a false page can open floodgates to potential threats.

It is my utmost responsibility to highlight and repeat the importance of caution to users. Staying informed, alert, and proactive is not just a recommendation; it’s a crucial component for you to hold.

Osama Belaama
Mastering data visualisation choosing the right graph for your data

Mastering data visualisation: choosing the right graph for your data

In this blog, we will delve into the mathematical and practical aspects of selecting the most appropriate data visualisation method. We will offer insights on when and why you should use each one.

As a senior data analyst working in a tech mobility company, I have encountered various data types. I have found that the choice of the right graph, plot, or chart can significantly impact the way one perceives and interprets data.

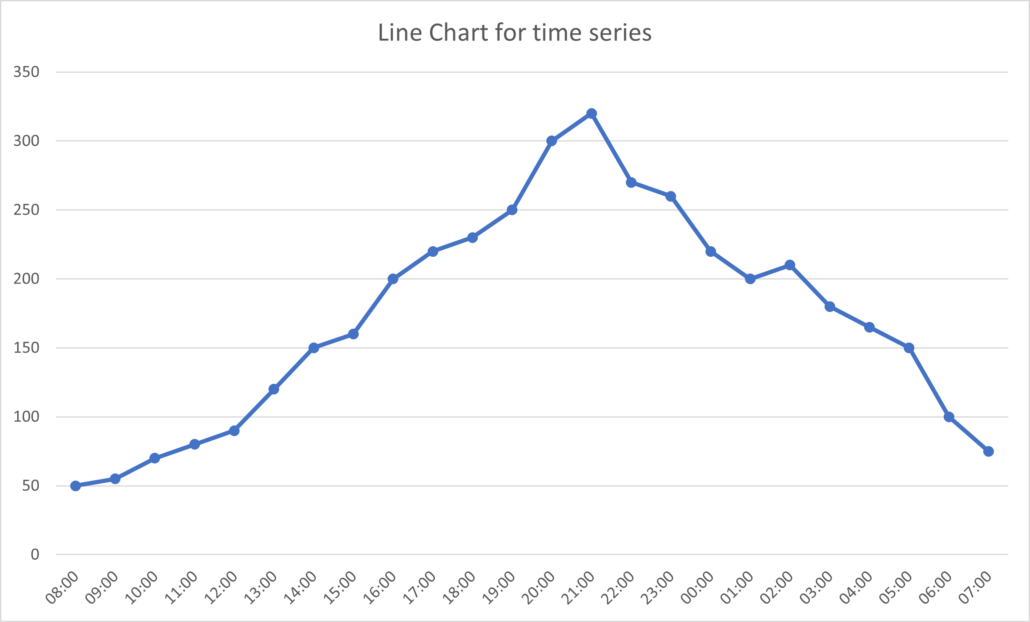
Line charts for time series data

Time series data, which represents information collected over time, is prevalent in almost every industry.

The cab industry we track daily ride volumes, revenue over weeks, and driver hour trends. This makes line charts an excellent choice.

The reason is rooted in the fundamental concept of continuity. Line charts visually represent the data points as connected by lines, highlighting the sequence and trends within the data.

Mathematically, the line charts interpolate between data points, making them suitable for time-based data where intermediate values matter. The interpolation assumes a continuous change in values between points.

When creating a line chart for time series data, remember to ensure that the time intervals between data points are constant, making it suitable for mathematical operations such as differentiation or integration, which can be used for trend analysis or forecasting.

The line chart below illustrates a steady continuous growth to a peak, trailing off to a relatively similar position as at start. This could be an indication of patterns dependant on time of day.

Mastering data visualisation

Bar charts for categorical data

Categorical data, which consists of discrete categories or labels, plays a vital role in the cab industry when analysing customer feedback, driver ratings, or ride types.

Bar charts are the go-to-choice for visualising categorical data. They represent each category as a separate bar, with the height of the bar corresponding to the frequency or proportion of occurrences of that category.

Mathematically, bar charts use a discrete, non-continuous axis. This means that there is no interpolation between bars, making it the ideal choice for discrete categories.

Moreover, bar charts are versatile and can be displayed as either horizontal or vertical bars, depending on the preference.

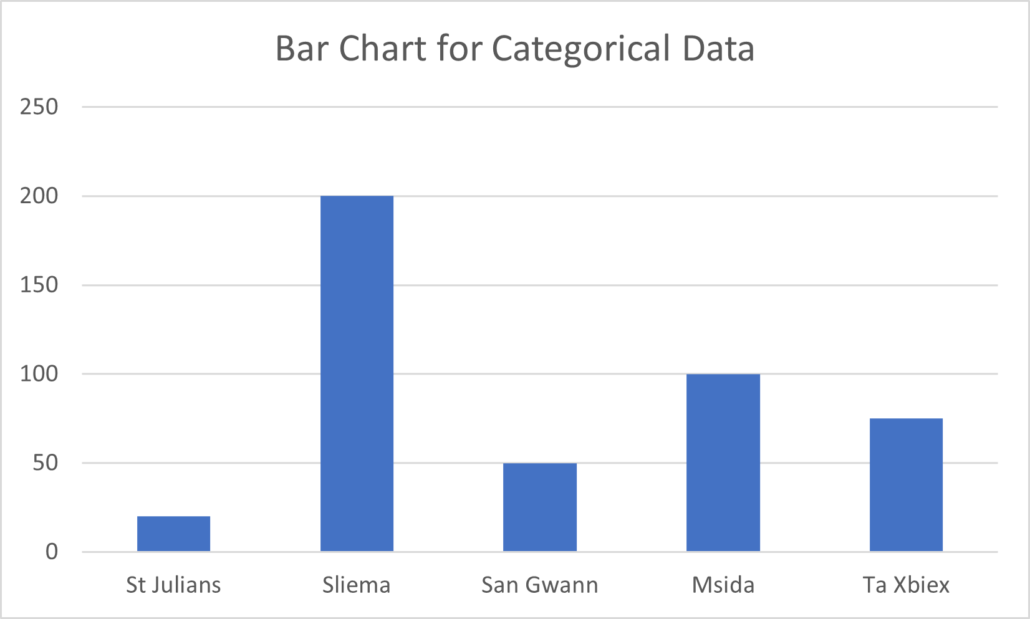
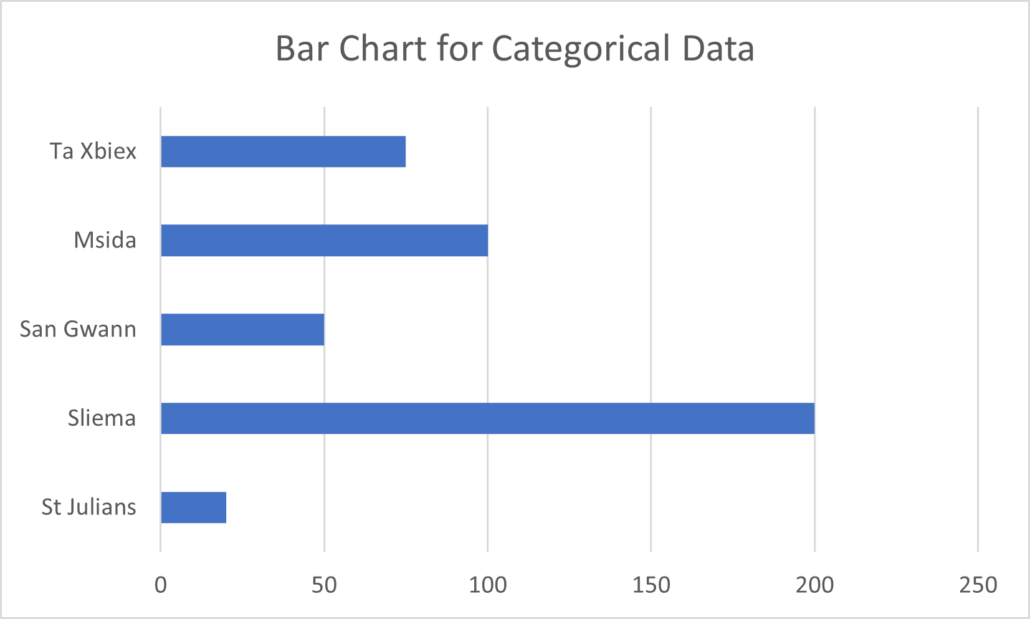
They allow for easy comparisons between categories and we can use them to illustrate trends or patterns in the data. The below bar charts make use of identical dummy data relating to the locations of pickups of users.

The horizontal and vertical bars are selected at the analyst’s discretion and depending on what is best to communicate the final results.

Pie charts for parts of a whole

When you need to visualise the composition of a whole dataset, pie charts are a valuable tool.

In the cab industry, you might use pie charts to show the percentage breakdown of revenue sources, expenses, or customer demographics.

Mathematically, pie charts represent a circle divided into slices, with each slice corresponding to a component’s portion of the whole. The angle of each slice is proportional to the component’s size relative to the whole.

Pie charts are particularly useful when you want to emphasize the part-to-whole relationship and provide a clear visual representation of proportions.

However, it’s important to use pie charts sparingly and ensure that the data is not too complex. As it can be challenging to compare multiple pie charts.

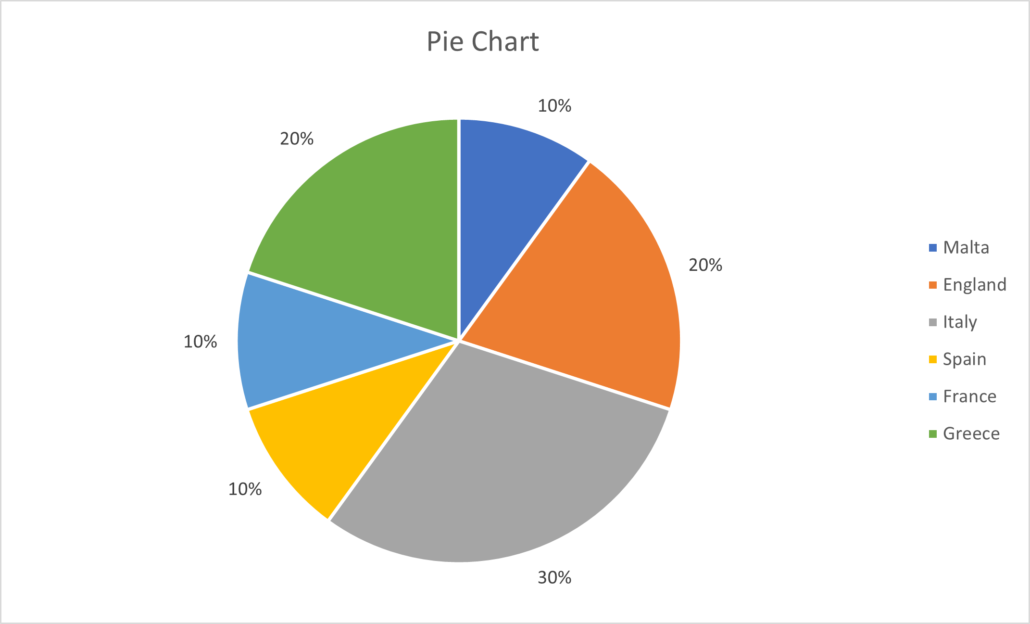
The pie chart found below illustrates the segmentation of users coming from which countries, determined by the mobile number prefix. This can be useful when trying to understand user demographics.

Mastering data visualisation

Scatter plots for correlation and relationships

In the cab industry, understanding the relationship between different variables is crucial. Scatter plots are a powerful way to visualise the correlation between two continuous variables.

This is especially useful when studying factors such as ride duration versus distance travelled or driver ratings versus ride frequency.

Mathematically, scatter plots display data points as individual dots on a two-dimensional plane, with one variable on the x-axis and the other on the y-axis.

By plotting data points this way, you can visually assess the presence and strength of any linear or non-linear relationships between the two variables.

Scatter plots also allow you to identify outliers and clusters of data points. This can be essential for anomaly detection or identifying specific patterns in your data.

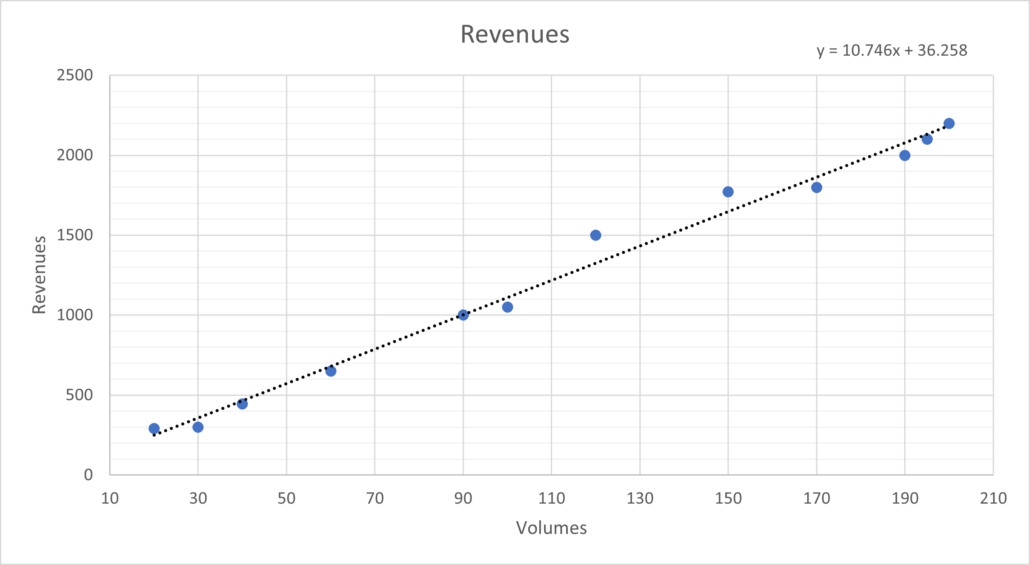
The scatter plot below illustrates the relationship between volumes and revenues. Here, we can see a clear linear relationship. We can easily extract an equation. And it can now be used to action changes in favour of company needs.

Mastering data visualisation

Histograms for data distribution

Understanding the distribution of data is crucial in the ride-hailing industry.

Histograms are a key tool for visualising the frequency distribution of a continuous variable, such as ride fares, customer ratings, or wait times.

Mathematically, histograms divide the range of a continuous variable into intervals or bins and represent the frequency or density of data points falling into each bin using bars.

The width and number of bins can be adjusted to fine-tune the level of detail in the visualisation.

Histograms help you identify the shape of the distribution, including whether it is normal (bell-shaped), skewed, or multimodal.

This information can be invaluable for making data-driven decisions and identifying areas for improvement.

Box plots for data distribution and outliers

Box plots, also known as box-and-whisker plots, provide a compact way to visualise the distribution of a dataset, as well as identify potential outliers and compare the distributions of different groups.

In the cab industry, we can use box plots to analyse driver earnings, customer wait times, or ride distances across different cities.

Mathematically, a box plot consists of a rectangular box and two whiskers. The box represents the interquartile range (IQR), with the median line inside. The whiskers extend to the minimum and maximum values within a certain range (typically, 1.5 times the IQR).

Box plots are ideal for displaying the spread, skewness, and presence of outliers in the data.

They allow for quick comparisons between different categories or groups, providing a concise summary of the data’s distribution.

Heatmaps for data density and correlation

Heatmaps are a versatile visualisation tool for displaying complex data relationships, data density, and correlations.

In the cab industry, you might use heatmaps to explore customer trip patterns, identify peak hours, or analyse geographical and geospatial distributions.

Mathematically, heatmaps represent data as a grid of coloured cells, with each cell’s colour intensity indicating the value or density. Heatmaps are particularly useful for visualising data over two dimensions, such as time and location.

Heatmaps can reveal trends, clusters, or hotspots in your data. This makes them a powerful tool for pattern recognition and identifying areas that require attention.

They are especially valuable when dealing with large datasets or multidimensional data.

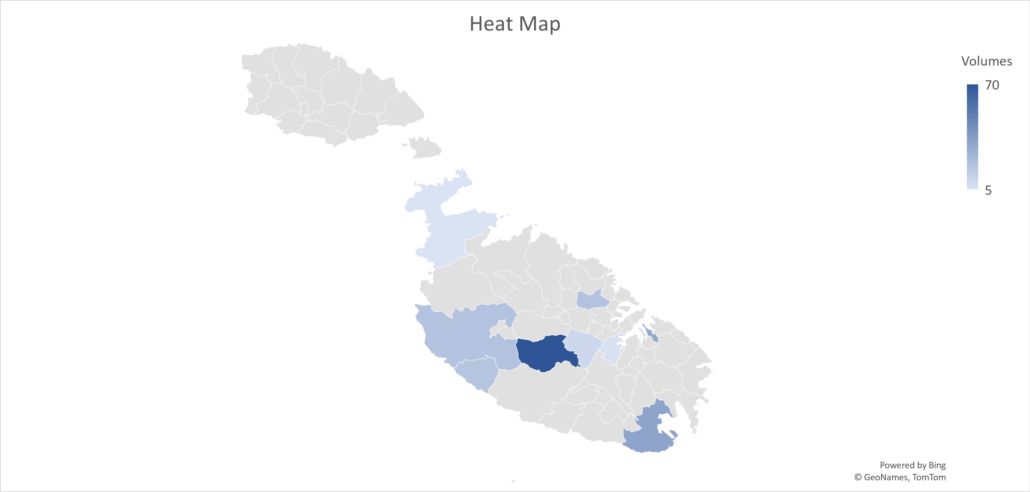
The heatmap below displays the density of volumes around our island, as part of a project that needed to determine optimal pathways using specific amounts of cabs.

Mastering data visualisation

Radar charts for multivariate data

When dealing with multivariate data in the cab industry, such as driver performance across various categories or customer satisfaction across different attributes, radar charts are a valuable choice.

Mathematically, radar charts represent each variable as an axis radiating from the centre. We connect data points to form a polygon. The shape of the polygon provides a visual summary of the values across multiple variables.

Radar charts are excellent for visualising the overall patterns and differences between entities (e.g. drivers, cities, or customer segments). They can reveal strengths and weaknesses in each entity’s performance in a clear and intuitive manner.

In conclusion, data visualisation and plots are invaluable tools for unlocking the hidden insights within vast datasets and conveying complex information in a comprehensible manner.

Whether you’re a data scientist, business analyst, or simply a curious individual looking to better understand the world around you, the power of visual storytelling cannot be overstated.

By choosing the right type of visualisation for your data, mastering the art of clarity and simplicity, and embracing the ever-evolving world of data visualisation technologies, you can harness the full potential of your data.

Happy visualising!

Mastering data visualisation
Using machine learning for cost optimisation

Using machine learning for cost optimisation

As a marketing data analyst working in the tech mobility industry, I mainly work on tasks centred around the needs and requirements of the Marketing Department.

But I also get to collaborate with different teams and work on projects that need my technical and scientific expertise.

I was recently approached by eCabs International Business Development Manager Ruslan Golomovzy as part of a large-scale project.

The task: to plan a permanent mobility solution for transporting hundreds of people to various destinations from an initial central location. And then back to their original destinations.

The goal: to assist the client in a cost-cutting exercise, reducing travel time (by 50%) to ensure employee satisfaction.  

It was a tall order that presented a unique set of challenges. Just the sort of thing I like to sink my teeth into.

We couldn’t simply provide an infinite number of rides for the users. Since that would strain the budget resources and interfere with restrictions set by our client.

So, what could we do instead? Eventually the discussion turned to machine learning.

Using the predictive model which I created, I was able to approximate the volumes of users during the project’s time window. You can find an explanation of this predictive model in my previous blog post.

I therefore had a rough estimate of how many cabs we could use for this project. I will denote this number of available (and maximum) cabs as the letter K.

K-means clustering algorithm

At an initial glance, it seems like a relatively easy exercise, right? Clustering locations that are within a certain radial distance and providing transportation that suffices to hold each cluster.

Optimising the number of vehicles ensures minimal resource cost and maximum customer experience.

On a small scale, this can be done manually or visually. But this particular exercise had hundreds of passengers, from varying destinations spread all over Malta.

So, I took a look at my scientific toolkit. And I decided to use an unsupervised learning technique called the K-means clustering algorithm.

This centroid-based algorithm is widely used in machine learning. It is used for grouping sets of unlabelled data points together based on a minimisation of the sum of the distances between the data points and their corresponding K clusters.

Identifying the most efficient trip paths

By clustering the pickup and drop-off locations of our customers, we are able to identify the most efficient trip paths together with the optimal number of cabs for this particular event that ensured minimal waiting time too.

Machine learning Julia Vella eCabs Technologies Marketing Data Analyst
Above is a screenshot with a small portion of the geographical locations for pickup, showing how it is not as simple as visually grouping points.

To get started, I collected the geographical locations of the pickup and drop-off locations in latitudes and longitudes coordinates in order to pre-process the data.

I plotted them on a map to visualise the distribution across Malta. So that I could give a first guess at the number of clusters I thought would suffice. Thus ensuring it was less than (or equal to) the K value I previously determined.

However, it is important to note that most cases would need the use of the Elbow method in order to find the optimal number of clusters.

Where the ‘magic’ happens

I wrote a small Python script to train the K-mean clustering algorithm on my dataset. And it grouped these locations into K clusters based on their proximity to each other.

Training is where the magic happens. In this case, training was performed by assigning each data point to the cluster with the closest centroid. And the variance is then calculated for each point such that a new centroid is placed within each cluster.

This is an interactive procedure that repeats until reassignment occurs. In which case the model stops, and the K clusters are finalised.

I ended up with a less value of clusters than I had previously estimated, which was satisfactory.

The final clustering results were plotted on the map to visualise the algorithm’s suggestion.

It was interesting to note that some clusters contained many people and thus demanded the need for a larger vehicle. Whereas some clusters only contained two people such that a smaller vehicle sufficed.

At first glance, we wanted to group these small clusters in other larger ones to reduce the cab quantity. But upon inspection it made more sense to leave them isolated due to their distance from the centralised pickup location and thus much larger driving time – which was a much-appreciated suggestion from the method.

Saving time, money, and resources through machine learning

It is important to note that at the end of the day, these models are objective suggestions. Such that if certain requests are made by the users or if a B2B client has further restrictions, limitations, or requirements, they can easily supersede these results in the final planning stage.

In conclusion, the K-mean clustering algorithm proved to be a valuable tool for optimising trip paths and the number of resources needed for our large-scale collaborative project.

By using this machine learning technique, I was able to offer the B2B team a solution to save time, money, and resources. While still providing excellent service to our customers, cutting waiting time by 50%.

References:

Andrew Bezzina traffic congestion

eCabs Malta CEO suggests solutions as traffic leads to students missing exams

Students are missing O’ Level exams due to the ever-growing traffic congestion on the island of Malta – and eCabs Malta CEO Andrew Bezzina has taken to social media to share some possible solutions.

Traffic congestion and roadworks continue to be a major problem for students trying to get to their exams on time.

As a father of two, it won’t be long before my kids are sitting for their O’ levels and my family will have to shuffle between work and ensuring they get to their exams.

This can be a logistical nightmare for families.

What can be done to alleviate this situation?


Here’s a suggestion: rather than having students from all over the island flood into a single examination centre, the authorities should explore carrying out Matsec exams in students’ own schools or in regional catchment areas to avoid generating more traffic.

Rather than students travel to their exam centres, the exams centres should come to them.

As a tech company, at eCabs we collect huge volumes of data on traffic flows which show that Matsec season clogs up central areas of the island.

Transport authorities could draft cycle and walking routes for students within a five-kilometre radius and even encourage public transport for students as an affordable and reliable alternative to being driven to their exams.

We believe that by working together, we can create a better and more efficient system for everyone.

Let’s work together to ensure that students have access to the education they need, without the stress of navigating through traffic.

The reason behind the traffic chaos

According to online portal Lovin Malta, it seems that most of the traffic originated from the road closure of Triq is-Salina which will be out of bounds to vehicular traffic until 15th June.

Some students and their parents reported leaving their homes at 7.30 am and still not arriving at their destination by 9.00 am, with standstill traffic being reported along the St Paul’s Bay area from 7.00 am onwards.

In the press:

Lovin Malta | Times of Malta | Malta CEOs | Malta Daily

Julia Vella driving data

Driving data to predict passenger volumes

I’m a Senior Data Analyst at eCabs Technologies. But when people ask me what I do all day – I tell them I’m storytelling

Data is a collection of raw and discrete values that make no particular sense at first glance. It usually sits inside a data warehouse, which not only stores, organises, and manages the data but also allows querying and quick analysis. It is a core component of business intelligence and creates a space for number crunching, reporting and scientific study.

As a marketing data analyst, my job involves collecting, organising, and analysing all the relevant data to help inform and sometimes answer business decisions, primarily centered around the Marketing department’s needs.

At its core, data analysis is the process of using statistical and mathematical techniques to make sense of the information available to us so that I can turn what looks like Matrix-style numbers into stories that even non-technical personnel can understand. 

Whether I’m looking for patterns in the number of rides requested at particular times of the day or trying to quantify the reasons for cancelled pick-ups, app open sessions or passenger ETA, what I’m really doing is asking questions to tell better and more relevant stories that can eventually answer some vital business questions.

So, while a lot of it is invisible to the naked eye at first, what I’m doing is uncovering information. By observing users under an analytical microscope and looking at their interaction within the ride-hailing industry.

I will use this blog space to talk about some of the nuts and bolts of what we do here at eCabs Technologies as we try to improve your mobility experience.      

But this first story is special to me. 

Asking the right question

In early 2023 I made use of a powerful yet relatively simple supervised learning method in my data analysis toolkit. It is called simple linear regression.

This technique allows me to investigate the relationship between two variables. These are often referred to as the independent variable (X) and the dependent variable (Y). In this case, the user volumes and driver hours respectively. By using simple linear regression, I can determine how changes in one variable affect the other variable.

I applied a linear regression analysis to a large data set that contained a few years’ worth of values for both the volumes of rides of eCabs users and that of partner driver hours.

This came about after asking this question. “How many more driver hours would it take to make a noticeable impact on user volumes?”. The answer may be  intuitive to some, so much so that you may have already guessed what type of relationship exists here, but to what degree?

I wanted to be able to quantify this to a relatively high accuracy. And be able to approximate how many more people would request rides if there was a controllable and known number of increased drivers available at a given time.

Doing my homework

Before applying this technique, I needed to first ensure that my data abided by and respected the standard rules and limitations of linear regression. As with any algorithm, we need to check the foundation of assumptions before we apply it. Otherwise, any analyst runs the risk of faulty and misleading results. 

The first is that simple linear regression assumes there is a linear relationship between the independent and dependent variables.

This may not always be the case though.

There may be non-linear relationships or interactions between the variables that are not captured by a simple linear mode. In our scenario we assume linearity over large scales. 

Other limitations include the assumptions of independence, homoscedasticity, and normal distribution.

If we do not respect these assumptions, then applying the algorithm anyway would provide errors and inaccuracies in the results that would deem them useless.

Outliers and influential data points may also distort the result, impacting the estimations. But for our exercise we may assume that these are all respected. 

Therefore, while useful analytical methods may be used for making predictions, it is important to research and respect their limitations. As well as carefully evaluate their assumptions and ensure the data follow in their shadows, especially when considering the potential sources of error when interpreting the results. 

“I used a very simple approach”

After carrying out this preliminary analysis, I adopted a very simple approach. That of extracting the two relevant fields from our data warehouse, and loaded them into arrays in Python.

I imported a few data science toolkits into my script, namely sklearn and sklearn.metrics.

I then split the arrays into training and testing sets as part of this learning algorithm and in order to use them in the relevant package.

The model was trained using these sets. And immediately made the necessary predictions as part of linear regression.

The resulting coefficient was outputed together with the mean-squared error to describe how well these two variables were related and to what degree they can be ‘trusted’.

Using best practices in data analysis

A simple line graph was fitted to the scatter plot of the dependent and independent variables to better display the relationship between them.

This forms part of the best practices in data analysis and science as plotting results is always the most concise and diligent way of communicating results. It also comes full-circle regarding the story-telling part of my expertise since a picture speaks a thousand words. 

I also found an equation for this fitted graph. So that, as simple as that, if we plug in the values for the number of driver hours that we have a direct impact and influence on, we can now approximate the user volumes that eCabs can expect.

We now have a way of influencing our independent variable (volumes) with our dependent one (hours).

This also gave a clear ‘maximum’ number of drivers that had absolutely no effect on the number of volumes. So much so, that no matter how much they increased past a certain amount, there were no noticeable fluctuations in users in the data and would instead cause the drivers to waste time.

This is saturation. It can be used to optimise hours on the road. Thus mitigating bad impressions and driver experience.

Improving customer and driver experience

This process taught me that it doesn’t always need to be impressive pipelines in complex code with a million data points.

Sometimes it is as simple as seeing how sets of variables grow or decay together, plotting a graph and finding the equation to best describe their relationship.

This is something that is done in beginner maths and physics. So next time a kid asks, “When will I use this in real life?”, get them to read this.

In the end, I settled on a multiplier that predicts passenger volumes in relation to the number of drivers out on the road with less than a 10% error margin.

The data said, ‘Hey if you put out say X more drivers at this time, you increase the probability of securing a passenger by Y’.

This changed how eCabs manages its relationship with all partner drivers.

We could see when we needed to incentivise for the supply of driver availability, and when we did not. Thus, ensuring there is no saturation of drivers.

This did not just improve customer experience, but by transitivity, that of the drivers working on the eCabs platform too.

For eCabs, we translated the formula into cost analysis, and revenue projections. It was even fed into marketing and operations plans.   

It was a win3.

Roberta Metsola European Parliament eCabs Matthew Bezzina

European Parliament President Roberta Metsola visits eCabs offices

On Monday 29th August, eCabs welcomed the European Parliament President Robert Metsola.

During her stay, the President went around the offices to meet members of staff, with a particular focus on technology, and discussed the future of the mobility industry in the EU with the organisation’s heads.

“It was a pleasure to share our ambitious vision and our internationalisation programme which is set to start in 2023 with President Metsola. We held meaningful discussions on our ESG agenda, the opportunities and the goals of our company, as well as technology and the future of the mobility industry within the European Union. It was also lovely to see how warmly our team greeted her and how well she interacted with them”, said Matthew Bezzina, eCabs Technologies CEO.

On her part, the European Parliament President wished eCabs success and further emphasised the importance of solid values in today’s business strategy.

Sustainability, innovation, green. Three characteristics which, in today’s world, should be the basis of any policy or project enacted by both public and private enterprises. Qualities that the Maltese company eCabs has embraced over the past years. This morning we spoke with team members at eCabs about how the European Union can do more for businesses, enterprises, and companies in Malta and across Europe”.

As Malta’s largest ride-hailing firm, eCabs remains committed to leading the industry with innovative technology solutions guided by ESG principles.

Key actions include drastically reducing the business’s carbon footprint whilst cultivating a multicultural team of technologists to fuel growth on an international scale.

In the press:

Malta CEOs

eCabs in record start to 2022

eCabs in record start to 2022

Maltese ride-hailing company eCabs has seen customer journeys during the first three months of 2022 grow by more than 50 per cent, compared to the same period in 2019, which is its best performing year to date. As the company gears up to expand internationally, Malta Today spoke with Dr Andrew Bezzina, CEO at eCabs’ Malta operation about how the ride-hailing company achieved this success and what the future holds.

“It’s easy to forget that just last January tens of thousands of people were in quarantine. Tourism and nightlife, our two main segments, were at a standstill compared to forecasts. To have emerged from such a poor start to year so strongly is a fantastic result and a testament to the quality and efficiency of the service we deliver,” says Dr Bezzina, reflecting on the impact the Covid-19 pandemic has had on the business.

“Of course, we had already started to see a recovery in our business in the summer of 2021 when restrictions were first eased. But, the Omicron variant and, I must say, overly cautious decisions from various governments which heavily impacted travel, put a stop to that. Thankfully, things are looking a lot better now. In fact, the bounce back from the omicron variant is much swifter than initially anticipated and ride volumes in the first three months of the year are up more than 50 percent from those registered in the first quarter of our record year in 2019.”

Swift growth in customer journeys in 2022

When analysing the swift growth in customer journeys registered this year, Dr Bezzina highlights the increase in travel as a key factor. “With the airport once again becoming a popular pick-up and drop-off point again and an uptick in demand for longer rides, the average price per ride is also increasing steadily. This is paving the way for healthier EBIDTA margins”, he says, before adding that, “The return to working from the office and a generally more positive atmosphere is encouraging people to go out more, especially in the evenings. The further easing of restrictions announced this week is welcome as it will certainly further strengthen consumer confidence and further support the recovery in tourism.”

The current positive outlook would not have materialised had it not been for several key decisions taken at the height of the pandemic, many of which are proving their worth up to this day. “eCabs has always been a financially prudent business but the impact of the pandemic made us even more focused on taking a responsible approach to our business and operational decisions in swift fashion, and pushed us to continue fine tuning our operating costs,” explains Dr Bezzina. “A leaner and more dynamic operating model is certainly helping us to cope with inflation and the supply chain challenges that are now affecting Malta and the global economy.”

From a ride-hailing business to a technology platform

Aside from improvements in efficiency, a major focus for eCabs in recent months has been its technology company, Cuorium Technologies. “Becoming an international player in the mobility space means eCabs must continue its transformation from a Maltese ride-hailing business, to a technology platform deployed in various territories, serving customers and fleets anywhere in the world. We have invested heavily in this area over the past two years and the results we are seeing in Malta, with its complex infrastructure and demanding customers, prove that both our technology and our business model work,” says Dr Bezzina.

eCabs 2022 tech

Cuorium Technologies is, in fact, at the heart of eCabs’ plans for growth. “Our experience in Malta confirms that this technology can be taken into any market and we’re now working hard to raise the funding we need to move into carefully selected international markets. Whilst the interest has been extremely positive from various corners of the world, strategy leads our decisions.”

Partner Drivers

“2022 has started very well for eCabs and the outlook for our Malta operations is very positive. On this basis we have set ourselves the ambitious target of doubling the number of journeys we delivered in 2019. This, inevitably, means that we need to attract as many partner drivers as we can. We already have more than 1,400 partner drivers in Malta using our platform and will continue doing all we can to offer the best possible working conditions. Our engagement with drivers is also key to reducing the carbon footprint of our business as we work towards fulfilling our commitment to have a fully electric and hybrid fleet by 2025, something which is a key strategic priority for us. This year, eCabs will also be buying 15 electric vehicles for its own fleet,” continues Dr Bezzina.

The eCabs Malta CEO concludes, “A stronger than ever post pandemic recovery remains our key priority but despite the challenges, we didn’t lose sight of our long-term strategic goal. eCabs is merging from this challenging period in the best shape ever and is ready for an exciting and prosperous future.”

In the press:

Malta Today | Business Today

eCabs Chief Technology Officer Luca de Michele

eCabs appoint Chief Technology Officer

Technology arm poised for steady growth with appointment of Luca Di Michele as Chief Technology Officer.

Luca Di Michele has taken over the stewardship of eCabs’ technology team as Chief Technology Officer. He will be leading a growing multi-cultural team of software engineers from 13 nationalities. The team is building and shaping eCabs’ mobility technology platforms together with a growing extended team composed of QA specialists, product specialists, business analysts, and data analysts.

This appointment follows the company’s recent announcement of its corporate restructuring exercise. This saw the appointment of Andrew Bezzina as the new CEO for eCabs’ local operations. Matthew Bezzina is now leader for global operations and CEO for Cuorium Technologies, eCabs’ Technology arm.

Luca Di Michele joined eCabs in June of 2018 as a Senior Developer, moving on to Head of Development in September of 2019. In this role, he headed the team of developers at the newly set up Cuorium Technologies.

“Exciting times ahead of us” – eCabs Chief Technology Officer

“The company has been going through interesting phases of renewal and transformation over the past few years. I feel privileged to have been an integral part in shaping this transformation. We have built an awesome team of professionals here whom I am proud to have as colleagues. They are all driven by the same passion to see their creations come to life. And being given the liberty to explore and lead new technologies . We have exciting times ahead of us,” says Luca Di Michele, eCabs Chief Technology Officer.

eCabs Chief Technology Officer

Matthew Bezzina laid praise to eCabs’ new Chief Technology Officer saying, “Luca fully deserves this position. He has been given the space to grow. He has shown incredible ownership and leadership in building the technology that drives our platform with his team. Luca shares the same love and passion towards the brand as we do, and today knows this business inside out. We are fully confident that together with his growing team, we will keep our technology on its steady path, making an international success of it in the exciting years that lay ahead of us”.

In the press:

Times of Malta | Business Today | Who’s Who