
As a marketing data analyst working in the tech mobility industry, I mainly work on tasks centred around the needs and requirements of the Marketing Department.
But I also get to collaborate with different teams and work on projects that need my technical and scientific expertise.
I was recently approached by eCabs International Business Development Manager Ruslan Golomovzy as part of a large-scale project.
The task: to plan a permanent mobility solution for transporting hundreds of people to various destinations from an initial central location. And then back to their original destinations.
The goal: to assist the client in a cost-cutting exercise, reducing travel time (by 50%) to ensure employee satisfaction.
It was a tall order that presented a unique set of challenges. Just the sort of thing I like to sink my teeth into.
We couldn’t simply provide an infinite number of rides for the users. Since that would strain the budget resources and interfere with restrictions set by our client.
So, what could we do instead? Eventually the discussion turned to machine learning.
Using the predictive model which I created, I was able to approximate the volumes of users during the project’s time window. You can find an explanation of this predictive model in my previous blog post.
I therefore had a rough estimate of how many cabs we could use for this project. I will denote this number of available (and maximum) cabs as the letter K.
K-means clustering algorithm
At an initial glance, it seems like a relatively easy exercise, right? Clustering locations that are within a certain radial distance and providing transportation that suffices to hold each cluster.
Optimising the number of vehicles ensures minimal resource cost and maximum customer experience.
On a small scale, this can be done manually or visually. But this particular exercise had hundreds of passengers, from varying destinations spread all over Malta.
So, I took a look at my scientific toolkit. And I decided to use an unsupervised learning technique called the K-means clustering algorithm.
This centroid-based algorithm is widely used in machine learning. It is used for grouping sets of unlabelled data points together based on a minimisation of the sum of the distances between the data points and their corresponding K clusters.
Identifying the most efficient trip paths
By clustering the pickup and drop-off locations of our customers, we are able to identify the most efficient trip paths together with the optimal number of cabs for this particular event that ensured minimal waiting time too.
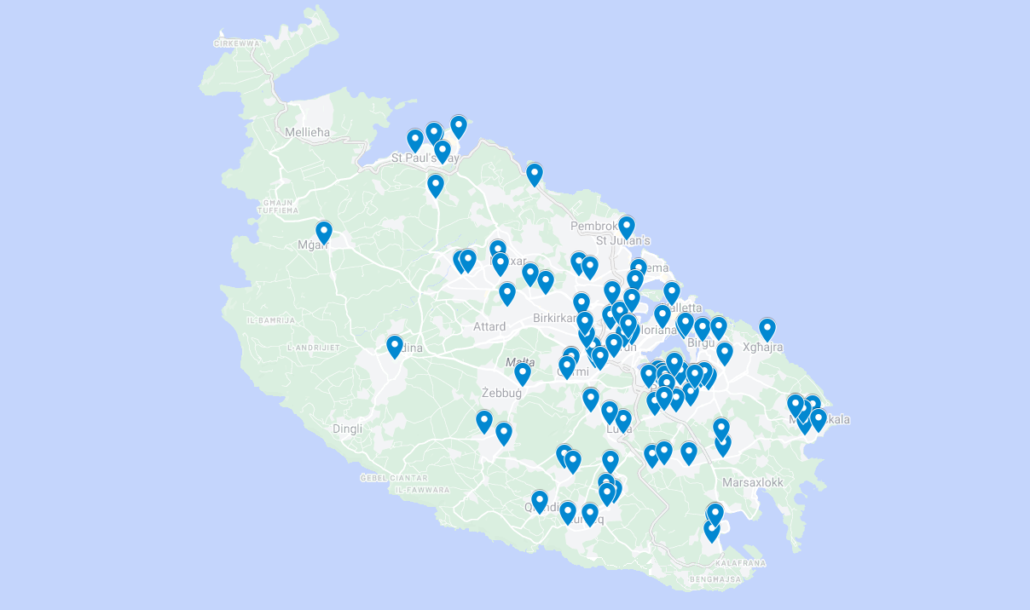
To get started, I collected the geographical locations of the pickup and drop-off locations in latitudes and longitudes coordinates in order to pre-process the data.
I plotted them on a map to visualise the distribution across Malta. So that I could give a first guess at the number of clusters I thought would suffice. Thus ensuring it was less than (or equal to) the K value I previously determined.
However, it is important to note that most cases would need the use of the Elbow method in order to find the optimal number of clusters.
Where the ‘magic’ happens
I wrote a small Python script to train the K-mean clustering algorithm on my dataset. And it grouped these locations into K clusters based on their proximity to each other.
Training is where the magic happens. In this case, training was performed by assigning each data point to the cluster with the closest centroid. And the variance is then calculated for each point such that a new centroid is placed within each cluster.
This is an interactive procedure that repeats until reassignment occurs. In which case the model stops, and the K clusters are finalised.
I ended up with a less value of clusters than I had previously estimated, which was satisfactory.
The final clustering results were plotted on the map to visualise the algorithm’s suggestion.
It was interesting to note that some clusters contained many people and thus demanded the need for a larger vehicle. Whereas some clusters only contained two people such that a smaller vehicle sufficed.
At first glance, we wanted to group these small clusters in other larger ones to reduce the cab quantity. But upon inspection it made more sense to leave them isolated due to their distance from the centralised pickup location and thus much larger driving time – which was a much-appreciated suggestion from the method.
Saving time, money, and resources through machine learning
It is important to note that at the end of the day, these models are objective suggestions. Such that if certain requests are made by the users or if a B2B client has further restrictions, limitations, or requirements, they can easily supersede these results in the final planning stage.
In conclusion, the K-mean clustering algorithm proved to be a valuable tool for optimising trip paths and the number of resources needed for our large-scale collaborative project.
By using this machine learning technique, I was able to offer the B2B team a solution to save time, money, and resources. While still providing excellent service to our customers, cutting waiting time by 50%.

